
21-04-2026
Inside the Color Spectrum: from light to quality in Industrial processes
The color spectrum is one of the fundamental concepts of optical physics and, at the same time, an essential operational tool across numerous industrial sectors.
From the production of paints and coatings to quality control in textiles, from printing to the food industry, the ability to analyze, measure, and reproduce color with precision depends on a solid understanding of the color spectrum.
In many production contexts, inaccurate color management can lead to production waste, returns, and additional costs, making color spectrum control a strategic as well as technical factor.
In this article, we explore what is meant by the visible color spectrum, how the science behind it has evolved, and which tools enable effective and reliable use today.
What is the Color Spectrum
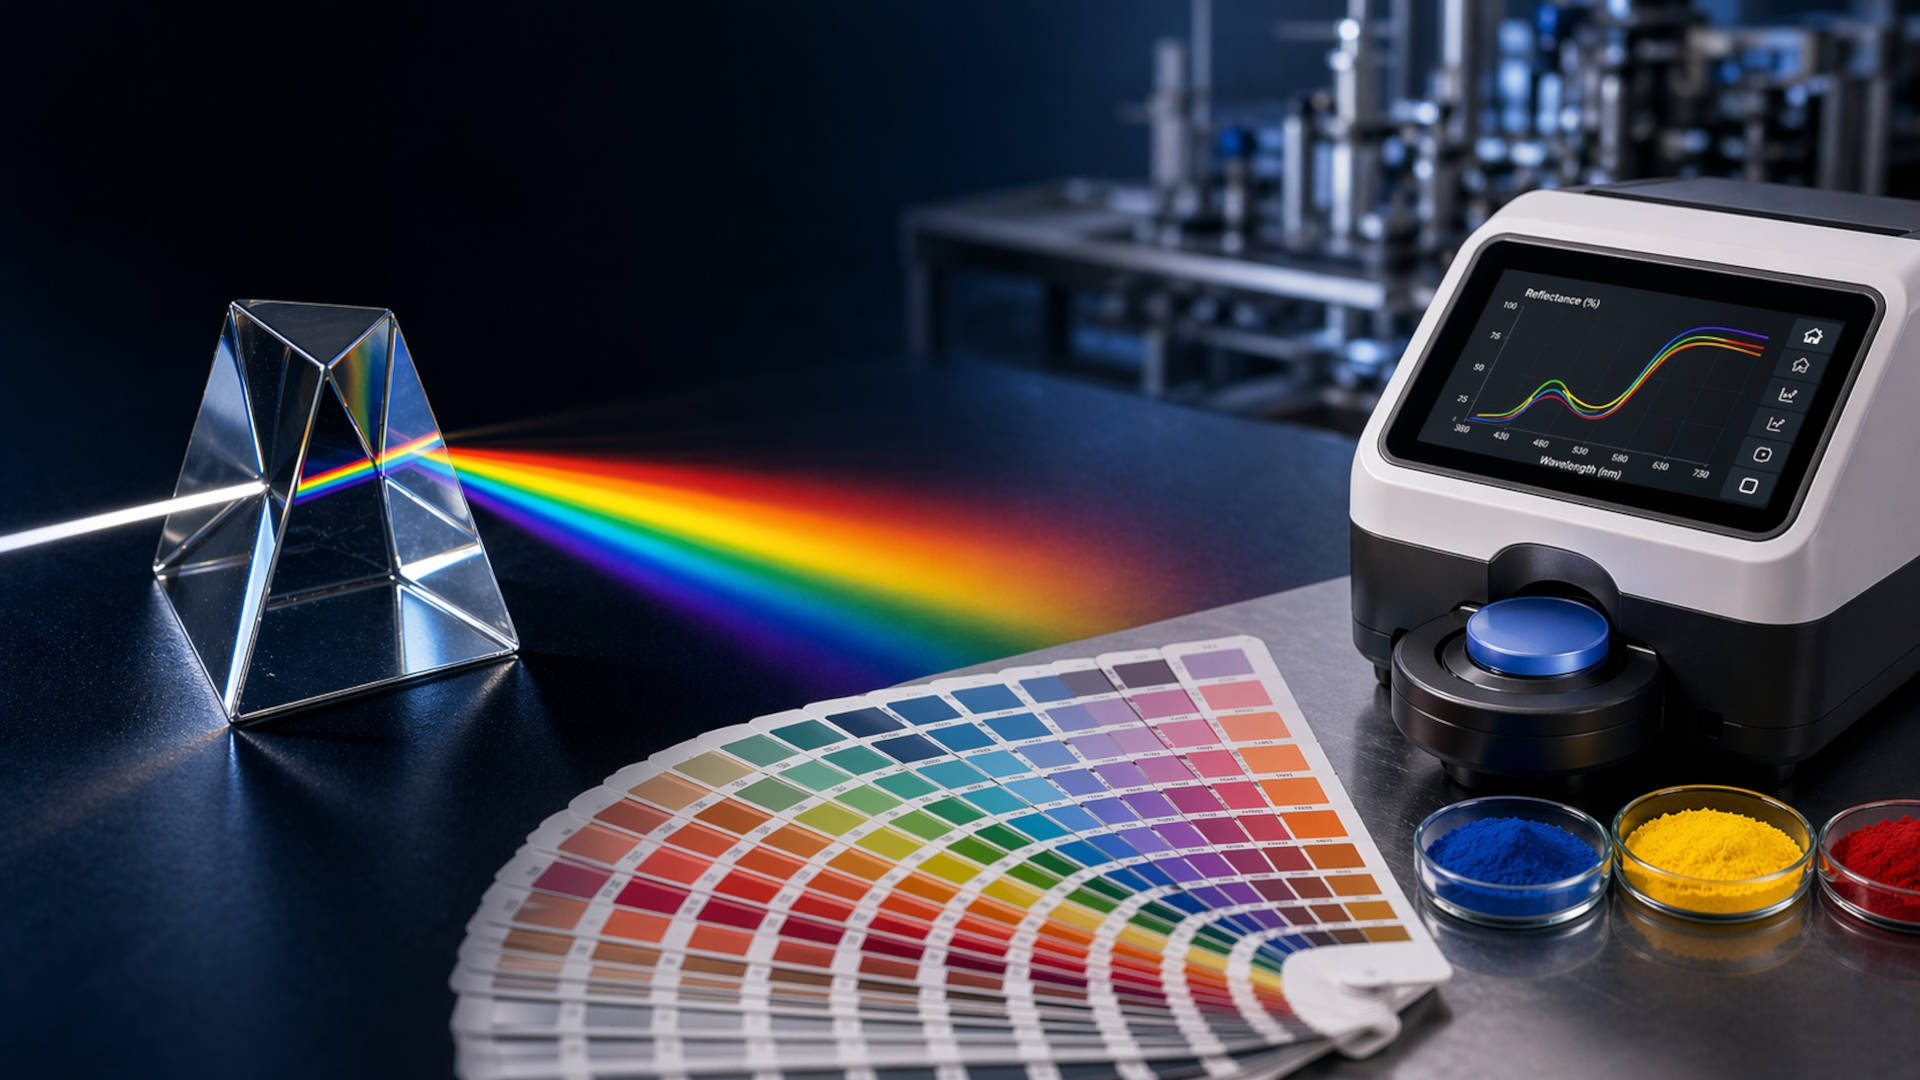
When white light passes through a prism or is diffracted by a surface, it splits into its monochromatic components, revealing a continuous sequence of hues ranging from violet to red.
This is the visible color spectrum: the portion of the electromagnetic spectrum that the human eye can perceive, ranging from approximately 380 to 700 nanometers in wavelength.
It is useful to distinguish two main types of light spectrum:
- Continuous spectrum: typical of sunlight and many incandescent sources, where all wavelengths are present without interruption. It produces the classic rainbow of smoothly transitioning colors.
- Discrete (or line) spectrum: characteristic of artificial sources such as vapor lamps or LEDs, which emit light only at specific wavelengths. This type of spectrum is fundamental in industrial spectroscopic analysis, as it allows precise identification of the composition of a light source or material.
This distinction is not only theoretical: in industrial practice, the quality of the light source used during color measurement directly affects the reproducibility of results.
For this reason, international standards, such as those defined by the CIE (Commission Internationale de l’Éclairage), specify reference illuminants for each application context.

Who discovered the Color Spectrum: from classical physics to modern colorimetry
The discovery of the color spectrum is commonly attributed to Isaac Newton, who in 1666 experimentally demonstrated that white light is composed of multiple colors through the well-known prism experiment.
Newton identified seven fundamental colors of the spectrum: violet, indigo, blue, green, yellow, orange, and red—a classification that is still part of common language today.
However, modern understanding of color goes far beyond Newton. In the 19th century, scientists such as Thomas Young and Hermann von Helmholtz developed the trichromatic theory of vision, explaining how the human eye perceives color through three types of receptors sensitive to different wavelengths.
It was in the 20th century that colorimetry became a structured scientific discipline: in 1931, the CIE published the first standardized color measurement system, introducing reference colorimetric observers and the CIE XYZ color space, still the basis of most international color standards today.
This system enabled objective communication of color between companies, suppliers, and laboratories worldwide, laying the foundation for modern industrial colorimetry.

What is the Color Spectrum used for in Industrial applications
In industrial contexts, the color spectrum is not an abstract concept but an operational tool with direct implications for product quality and process efficiency.
Companies working with colored materials—whether paints, plastics, textiles, inks, or food products—need to manage color in a systematic and verifiable way.
The main industrial applications of the color spectrum include:
- Quality control: ensuring that the color of the finished product falls within specified tolerances, avoiding visible defects or production waste.
- Color standardization: ensuring that the same color is reproduced consistently regardless of production line, facility, or geographic region.
- Batch color matching: comparing production samples from different supplies to ensure color consistency.
- Error reduction: proactively correcting color deviations during production, reducing waste and costly rework.
In all these contexts, instrumental color measurement, based on reflectance or transmittance spectrum analysis, replaces or complements subjective visual evaluation, providing objective and comparable data over time.
How the Color Spectrum works: wavelengths, reflectance and visual perception
The color we perceive when observing an object is not an intrinsic property of that object: it is the result of the interaction between incident light, the optical properties of the surface, and the response of the human visual system.
Understanding this mechanism is essential for working effectively with the color spectrum.
The visible electromagnetic spectrum ranges from approximately 380 nm (violet) to 700 nm (red).
Within this range, each wavelength corresponds to a specific color perception:
- 380–450 nm: violet and purple,
- 450–495 nm: blue,
- 495–570 nm: green,
- 570–620 nm: yellow and orange,
- 620–700 nm: red.
When light hits a surface, part of it is absorbed and part is reflected. The reflectance profile—that is, the percentage of reflected light at each wavelength—determines the perceived color. Similarly, for transparent or translucent materials, transmittance is measured.
These spectral data form the basis for spectrophotometers: instruments capable of measuring the optical response of a sample across the entire visible spectrum with nanometric precision.
Unlike visual evaluation, which varies from operator to operator and depends on lighting conditions, spectrophotometric measurement is reproducible, objective, and compliant with international standards such as ISO 13655 for graphics or ISO 7724 for coatings.
This approach allows a perceptual phenomenon to be translated into measurable data, directly usable in quality control and industrial standardization processes.

Types of Spectrum: visible, electromagnetic, and color models
When discussing the “color spectrum,” confusion often arises between distinct physical concepts. It is useful to clarify the differences between the main categories.
The visible spectrum is the portion of the electromagnetic spectrum perceptible to the human eye, ranging from 380 to 700 nm. Beyond these limits lie ultraviolet (UV) and infrared (IR) radiation, invisible to the eye but relevant in many industrial applications, from fluorescence to thermal control.
The electromagnetic spectrum as a whole includes all forms of radiation, from radio waves to gamma rays, with very different frequencies and wavelengths. In industrial contexts, knowledge of the entire spectrum is important in fields such as sensing, non-destructive testing, and chemical analysis.
Separate from these physical concepts, but often mentioned in this context, is the topic of color models.
RGB (Red, Green, Blue) and CMYK (Cyan, Magenta, Yellow, Key) are not types of spectrum in the physical sense, but conventional systems for representing and reproducing color in digital and print environments.
Their relationship with the visible spectrum is indirect: both attempt to simulate human color perception through combinations of primary stimuli, but neither can reproduce the entire color range of the visible spectrum.
For this reason, in industrial colorimetry, it is preferable to work directly with spectral data rather than RGB or CMYK values, which are device-dependent and have no absolute value.

Tools for working with the Color Spectrum: spectrophotometer vs colorimeter
In industrial practice, there are two main categories of instruments for color measurement, often mentioned together but with distinct characteristics and applications.
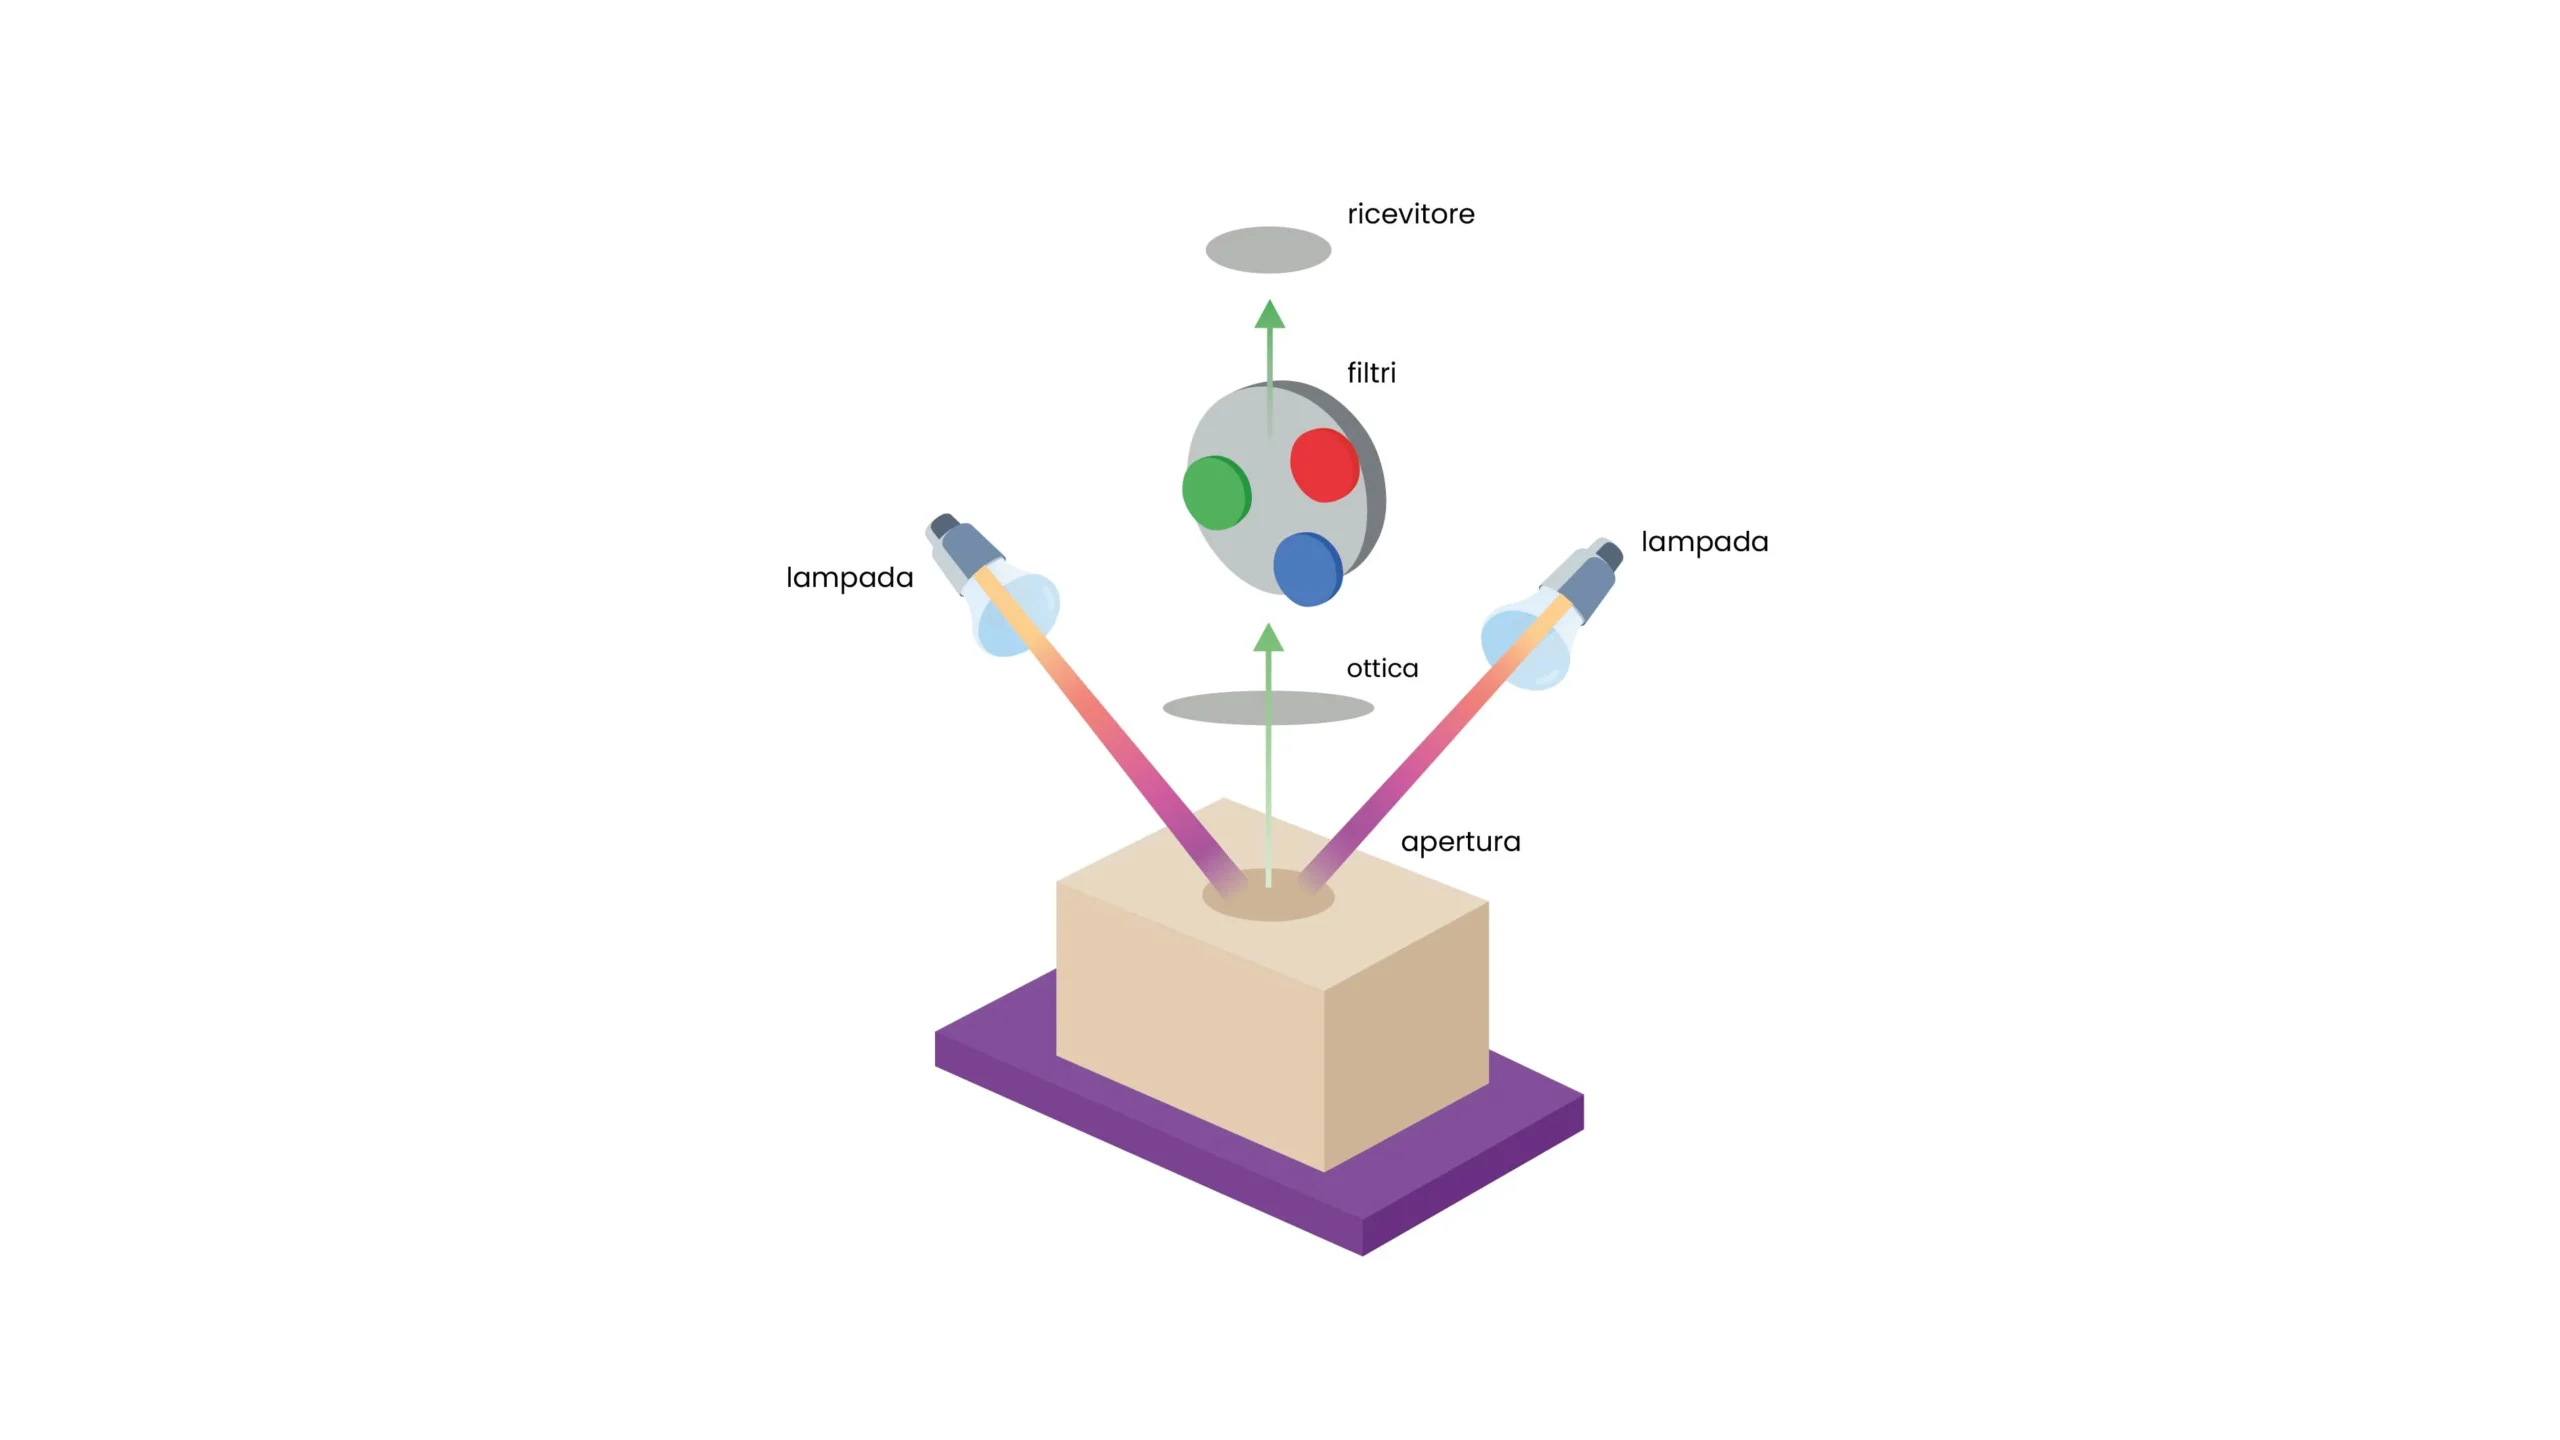
The colorimeter is a relatively simple instrument that measures color by simulating the human eye response through three filters corresponding to photoreceptor sensitivities. It provides numerical values in a color space (typically CIE Lab* or CIE XYZ) but does not provide the full spectral curve. It is suitable for quick color conformity checks on homogeneous surfaces, especially when measurement conditions remain constant.
The spectrophotometer, on the other hand, analyzes the sample wavelength by wavelength across the entire visible spectrum, providing the complete reflectance or transmittance curve.
This makes it the reference instrument for more complex and critical applications:
- Paints and coatings: verifying color consistency between batches and with reference standards.
- Plastics: monitoring color stability after molding processes or UV exposure.
- Textile industry: matching dyes across fibers with different spectral absorption properties.
- Food industry: monitoring color as an indicator of quality, ripeness, or spoilage.
The quality of measurement also depends on parameters such as the illuminant used, measurement geometry, and instrument calibration—key aspects for ensuring repeatable and comparable results over time.
The choice between the two instruments depends on the required level of accuracy and the complexity of the process.
In general, whenever it is necessary to communicate color unambiguously with suppliers or customers, or when dealing with materials affected by metamerism (objects that appear identical under one light but different under another), the spectrophotometer is the essential tool.

Why the Color Spectrum is strategic for Industry
The color spectrum is much more than a fascinating optical phenomenon: it is the scientific foundation on which color management in industrial contexts is built.
From the definition of CIE color standards to the measurement of spectral reflectance, every phase of the quality control process is based on principles derived from understanding the color spectrum.
For companies working with colored materials, having calibrated professional instruments that comply with international standards is not an option: it is a requirement for efficiency, consistency, and competitiveness.
Knowing what to measure, how to interpret spectral data, and which tools to use based on the specific production context is the first step in transforming color from a critical variable into a controlled element.
In this context, the adoption of advanced tools and standardized methodologies represents a concrete competitive advantage for all companies that treat color as a critical variable.
Subscribe to newsletter
You might be interested

ColorWorkDesk: The Innovative Software for Color and Paint Management
The colorimetry sector, increasingly influenced by digital innovations, required a ...
The Colorimeter: precision and Color control in industrial applications
Unlike the subjective perception of the human eye, this precision ...

Metamerism: what It is and how It affects Color Control
In the field of industrial colorimetry, metamerism represents one of ...

ColorWorkDesk: Measuring Color with Spectrophotometers
The study of color is a more complex field than ...

Light Booths: the fundamental tool for Color Quality Control
Light booths, also known as illumination booths or color viewing ...
Ask for a free consultation
Our experts will contact you to show you a demo of our products
