


21-10-2026
Colour Measurement: How to Measure Colour Objectively in Industrial Processes

In industrial production, colour is a product specification just like dimensions or composition. A paint that shifts slightly between batches, a plastic component that does not match one supplied by another manufacturer, or a fabric that looks different from the approved sample can all lead to waste, delays and disputes. Colour measurement turns a subjective judgement into numerical data that is repeatable and can be shared. However, obtaining reliable data requires more than simply having an instrument: it is essential to understand what is being measured and under which conditions.
What Is Colour Measurement
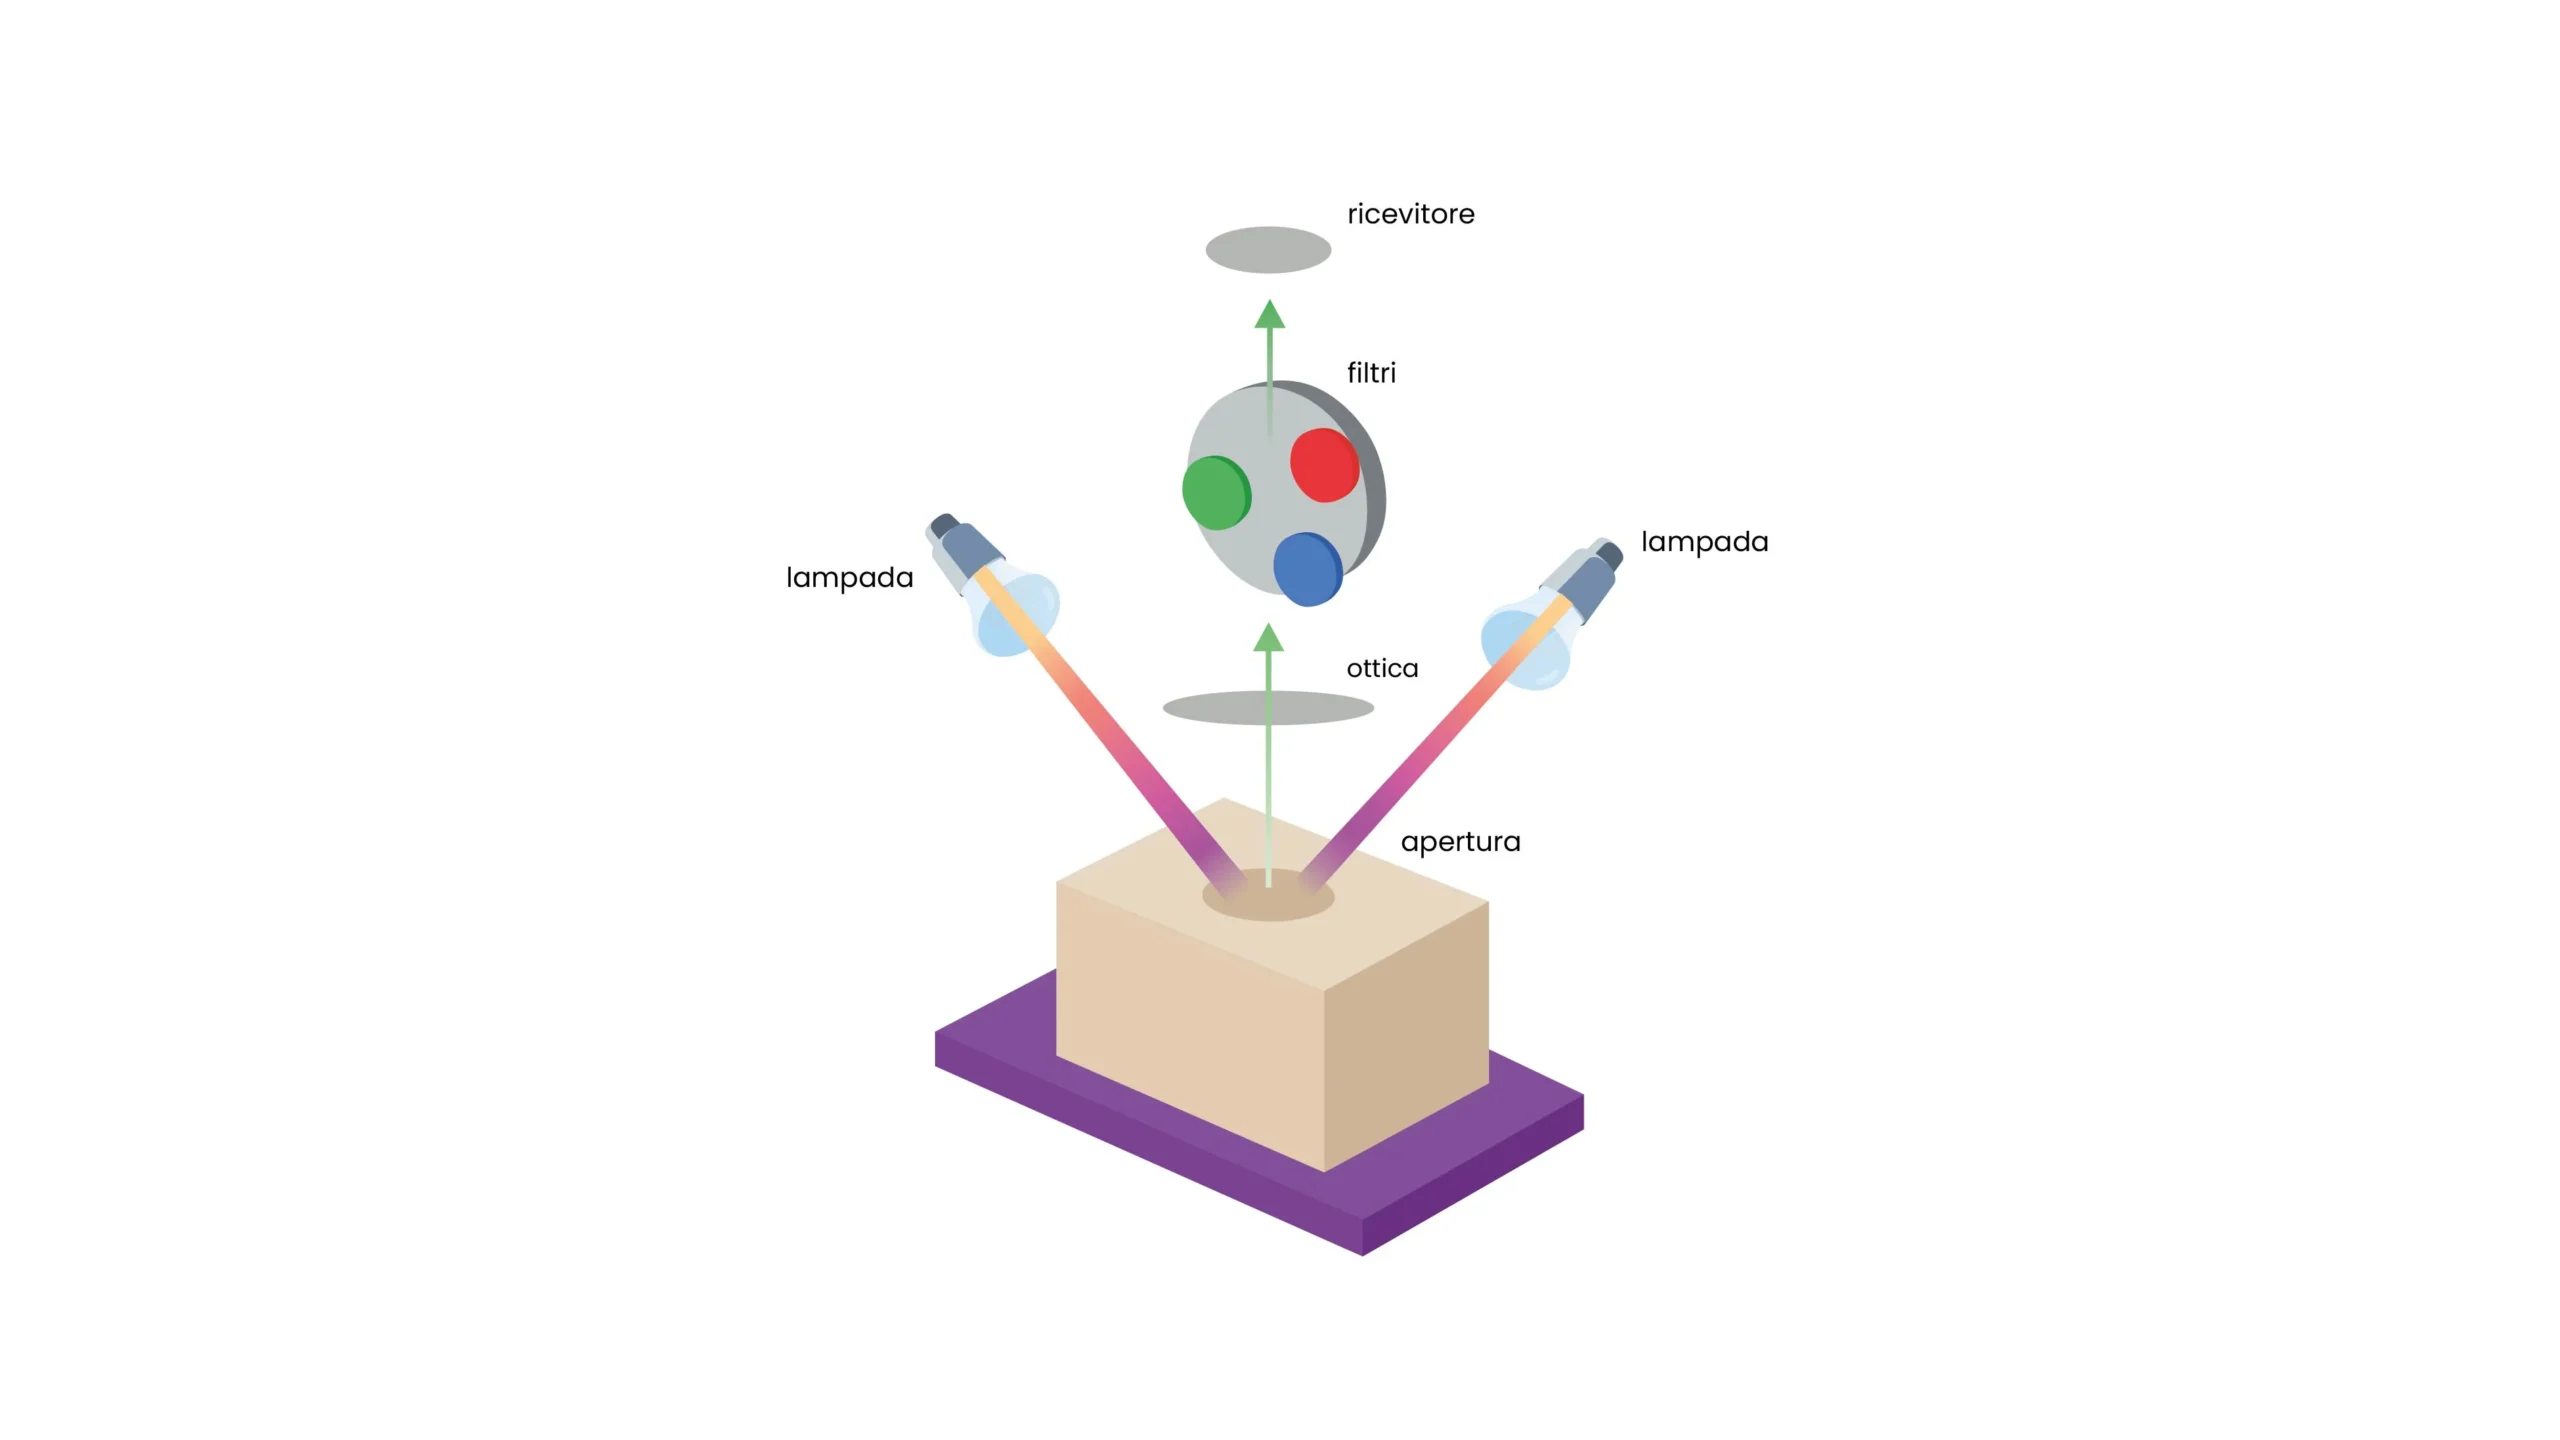
Measuring colour means quantifying how an object interacts with light and expressing the result as values within a shared system. The instrument illuminates the sample with a known light source, detects the reflected light (or transmitted light in the case of transparent materials) and, if it is a spectrophotometer, records its behaviour wavelength by wavelength across the visible portion of the electromagnetic spectrum.
These data are used to calculate colorimetric values by combining the sample’s response with a light source and a reference observer defined by convention.
The colour we see is not a property of the object alone, but the result of the interaction between light, material and the observer’s visual system. Two operators may judge the same sample differently, and the same person may change their assessment when moving from factory lighting to daylight, as explained in the article on colour perception.
Instrumental measurement does not eliminate these variables, but controls them by replacing the actual observer with a standard observer and ambient light with a defined illuminant. This is why a measured value is meaningful only when accompanied by the conditions under which it was obtained.
What Is the Role of Colorimetry and Standards in Colour Measurement
Colorimetry is the discipline that studies and quantifies colour. It provides the mathematical models linking the spectral composition of light to the average visual response, as well as the coordinate systems and formulas used to calculate colour differences. On its own, however, colorimetry does not guarantee that two laboratories will obtain the same result from the same sample. This is where technical organisations and standards come in, establishing shared reference data, measurement conditions and methods.
The international reference body is the CIE (International Commission on Illumination), which has defined standard observers, illuminants and colour spaces. Its recommendations on colorimetry are compiled in the technical report CIE 015:2018 (*Colorimetry, 4th edition*), while its core principles have been incorporated into the joint ISO/CIE 11664 series of standards, also adopted at European level as EN ISO/CIE standards. The parts of this series most relevant to routine colour measurement include:
- ISO/CIE 11664-1: CIE standard colorimetric observers;
- ISO/CIE 11664-2: CIE standard illuminants;
- ISO/CIE 11664-4: CIE 1976 L*a*b* colour space (CIELAB);
- ISO/CIE 11664-6: CIEDE2000 colour-difference formula.
Alongside these general references, there are industry-specific standards that define application methods, such as ISO 105-J03:2009 for calculating colour differences in textiles using the CMC(l:c) formula, and ISO 13655:2017 for spectral measurement and colorimetric computation in graphic arts.
It is also important to distinguish between what a standard requires and what constitutes good practice: the number of readings, calibration frequency and internal tolerances are often established by company procedures or contractual agreements rather than by a standard.

Why Measure Colour Instead of Relying on Visual Assessment
Visual assessment is difficult to document and communicate. A judgement such as “slightly warmer” does not indicate by how much or in which direction an adjustment should be made, and it cannot be verified by someone who does not have the sample in front of them.
In a supply chain where colour passes from the pigment manufacturer to the formulator, then to the processor and finally to the brand, consistent references are needed throughout the entire chain. In practical terms, having access to instrumental data makes it possible to:
- maintain colour consistency between batches, even months apart;
- document compliance with specifications agreed with the customer;
- share standards and results numerically with suppliers and production facilities, without having to ship physical samples at every stage;
- reduce disputes, because acceptance is based on criteria defined before delivery;
- detect process deviations before they lead to waste.
The importance of these benefits varies by industry. In paints and coatings, the typical challenge is ensuring that a subsequent supply or touch-up matches what has already been applied.
In the plastics industry, components moulded by different suppliers must match when assembled into the same product, as with vehicle interiors or appliance housings.
In the textile industry, the main priority is dyeing repeatability from one batch to the next, while in printing and packaging, matching brand colours is often an explicit contractual requirement.
Measurement does not, however, make the human eye redundant. Gloss, texture and certain effects of metallic materials cannot be fully described by colorimetric values alone, and standards are often approved through visual assessment as well.
Visual comparison becomes more reliable when carried out under controlled conditions, using defined light sources such as those provided by light booths: the instrument quantifies the difference, while the operator confirms whether it is acceptable in the intended context.

How to Measure Colour: Key Steps and Factors Affecting the Results
A reliable measurement follows a defined sequence of steps, applicable both in the laboratory and on the production floor, with variations depending on the instrument and material. The main steps are:
- sample preparation: a clean, representative surface in the required condition (dried paint, conditioned plastic specimen, fabric folded into multiple layers until opaque);
- instrument calibration, where required by the manufacturer, usually using a white standard and, for sphere-based instruments, a zero reference;
- setting the measurement conditions: geometry, measurement area, inclusion or exclusion of the specular component, illuminant and observer;
- data acquisition, often involving multiple readings taken at different points and averaged;
- comparison with the reference, whether physical or digital, according to the agreed tolerances.
Measurement Geometry
Geometry describes the relative positions of the light source, sample and detector, and is one of the parameters with the greatest influence on the result. The main configurations are integrating-sphere geometry, with diffuse illumination (d:8°), and directional geometry at 45°:0° or the equivalent 0°:45°. Sphere-based instruments can include the specular component (di:8°, often referred to as SCI) or exclude it using a gloss trap (de:8°, SCE).
The first reduces the influence of surface gloss and is useful in formulation; the second and the 45°:0° geometry more closely approximate how the eye perceives surfaces with different finishes. For metallic and pearlescent paints, whose appearance changes with the viewing angle, multi-angle instruments are required.
Standard Illuminant and Observer
The illuminant is a reference spectral distribution used in the calculation and should not be confused with the instrument’s internal lamp. D65 represents average daylight, A represents incandescent light, and CIE 015:2018 also introduced illuminants representative of different LED light sources.
The standard observer describes the average visual response. The two options are the 2° observer (CIE 1931) and the 10° observer (CIE 1964), which is widely used for industrial surface inspection, while the graphic arts industry typically uses D50 and the 2° observer. Changing the illuminant/observer combination changes the calculated values, so the combination must be specified and kept constant.
Surface, Texture, Opacity and Sample Presentation
Many variations attributed to colour actually depend on the sample itself. An embossed surface or a fabric with a pronounced weave requires a larger measurement area or multiple averaged readings; a paint film that is too thin allows the substrate to show through; a translucent sheet produces different values depending on its thickness and the background beneath it.
To characterise the colour of liquids, films and transparent sheets, transmission measurement is often used, with suitable cells or sample holders. The measurement method nevertheless depends on the purpose of the analysis and the characteristics of the sample. Temperature and humidity can also affect certain materials, such as thermochromic pigments or some textile fibres.
This leads to a practical rule: two values are directly comparable only when they are obtained under consistent conditions. Measurements of the same sample using di:8° and 45°:0° geometries can differ significantly, as can measurements taken with different illuminants, observers, apertures or sample presentation methods. When the standard and sample are measured at different facilities, it is good practice to agree in writing on the entire measurement configuration, as well as the tolerance.
CIELAB Values and Colour Difference ΔE: How to Interpret the Results
CIELAB Coordinates
The CIELAB colour space, defined by the CIE in 1976 and now described in ISO/CIE 11664-4, is the most widely used system for expressing surface colours numerically. Each colour corresponds to a point defined by three coordinates calculated from tristimulus values, rather than a verbal description. A comparison with other representation systems is available in the article on colour models. The three coordinates have specific meanings:
- L*: lightness, from 0 (black) to 100 (white);
- a*: the red–green axis, with positive values towards red and negative values towards green;
- b*: the yellow–blue axis, with positive values towards yellow and negative values towards blue.
The same coordinates can be used to derive chroma C*ab, which indicates how far a colour lies from the neutral grey axis, and the hue angle hab, which are often more intuitive for those adjusting a formulation. An isolated L*a*b* value, however, says little: it becomes meaningful when compared with a reference measured under the same conditions.
What Is ΔE and How Should It Be Interpreted?
ΔE expresses the magnitude of the difference between two colours as a single number. In its original form, ΔE*ab, it is the geometric distance between the two points in CIELAB space. Since CIELAB is not perceptually uniform, the same ΔE*ab value can correspond to differences that are more or less visible, depending on the region of the colour space. This is why weighted formulas such as CMC(l:c), CIE94 and CIEDE2000 have been developed. The latter is standardised in ISO/CIE 11664-6; these formulas adjust the calculation according to lightness, chroma and hue.
Different formulas return different values for the same pair of samples, so a ΔE value is meaningless unless the formula used to calculate it is specified. Likewise, there is no universally applicable acceptance threshold: the tolerance depends on the material, the end use, the hue and how closely the parts will be positioned in the finished product. It should be agreed between the parties and, ideally, also validated visually using limit samples.
The overall value should then be interpreted alongside its components (ΔL*, Δa*, Δb*, or ΔL*, ΔC*, ΔH*), which indicate the direction of the deviation. A sample that is darker, one that is less saturated and one that shifts towards yellow require different corrective actions, even when their overall ΔE values are the same. This interpretation connects the numerical result to the assessment of colour conformity against the reference.

Colour Measurement Instruments: How to Choose the Right One for Your Material and Application
The term “colour meter” is commonly used for any device that provides colorimetric values, but technically there are two main categories: tristimulus colorimeters and spectrophotometers. The choice depends on what needs to be measured and which decisions will be made based on the data.
A colorimeter uses filters that approximate the standard observer functions and directly provides tristimulus values for a defined condition. It is suitable for rapid difference checks in production runs involving stable colours and materials, but it does not record the spectral curve or allow results to be recalculated for different illuminants.
A spectrophotometer measures the reflectance or transmittance factor at regular intervals across the visible spectrum and calculates colorimetric values for any combination of illuminant and observer.
This makes it possible to assess how a sample behaves under different light sources, check for metamerism and provide data for formulation. The underlying principles are described in the article on colour spectrophotometry.
Beyond the type of instrument, the choice also depends on the sample characteristics and the context in which measurements are taken:
- Opaque materials (paints, solid-coloured plastics): reflectance measurement, with geometry selected according to the finish and intended use of the data;
- Transparent materials (liquids, films, sheets): transmittance measurement, using suitable cells or sample holders;
- Translucent materials: reflectance measurement with controlled thickness and background, or specific methods agreed between the parties;
- Textured and textile surfaces: large measurement apertures and averaging of multiple readings;
- Effect materials (metallic, pearlescent): multi-angle instruments;
- Place of use: portable instruments for checks on the production floor or on large components, and benchtop instruments for laboratory work and formulation.

Colour Quality Control: How to Use Results and Manage Colour Differences
In routine colour quality control, measurement is primarily used to compare a production sample with an approved standard. The standard may be a physical sample stored under controlled conditions or a digital reference based on spectral data. The latter avoids the ageing of physical samples, which can yellow or fade over time.
The result is compared against a tolerance, expressed as a maximum ΔE value or as separate limits for individual components, for example, with tighter limits for hue than for lightness. Colour management software allows standards and measurements to be stored, tolerances to be applied consistently and results to be tracked over time. When used systematically, measurement data support several activities:
- approving or rejecting batches according to criteria agreed before production;
- monitoring variability between batches and identifying gradual shifts;
- documenting non-conformities, with data that can be shared between supplier and customer;
- determining the corrections needed to the formulation.
It is important not to expect more from the data than they can provide. The instrument detects that a sample is darker or redder than the standard, but it cannot determine on its own whether the cause is an incorrect pigment dosage, a variation in the raw material, a different process temperature or improper specimen preparation. Interpretation requires measurement results to be cross-checked against process information. When a deviation needs to be corrected, the techniques described in the article on colour mixing and colour correction come into play.
A final case involves samples that match under one light source but differ under another. This typically occurs when two components coloured with different pigments are matched under daylight but look visibly different under the lighting used in a retail environment. Checking colour differences under multiple illuminants, which can be done with a spectrophotometer, helps detect this phenomenon before delivery. Its causes and verification methods are discussed in the article on metamerism.

Subscribe to newsletter
You might be interested
The Colourimeter: precision and Colour control in industrial applications
Unlike the subjective perception of the human eye, this precision ...

ColorWorkDesk: A Guide to Colour Formulation in Colourimetry
Colour is everywhere around us—in the clothes we wear, the ...

Light Booths: the fundamental tool for Colour Quality Control
Light booths, also known as illumination booths or colour viewing ...

Metamerism: what It is and how It affects Colour Control
In the field of industrial colorimetry, metamerism represents one of ...

Colour Perception: from physiology to Industrial standardization
Colour perception represents one of the most complex phenomena in ...
Ask for a free consultation
Our experts will contact you to show you a demo of our products
